The most common analysis performed with a produced sand sample is Particle Size Analysis (PSA) or Particle Size Measurement. This is the laboratory technique which determines the size range and/or the mean size of particles in a powder or liquid suspension sample.
The first and most important pre-requisite for accurate PSA is NOT the method – it is to have the right size, representative sample. If you measure junk, you will get junk data. The guidelines in posts B-FSM-009 (26-Sep-17) and B-FSM-010 (03-Oct-17) should be followed. Yes, a laser analysis can be performed on a 0.25 gram sample obtained through Millipore sampling and give you 100 gradations at four decimal places (something that make any decent quantitative chemist turn red with rage), but would you gamble the performance of your facility equipment on a few grains of sand? Take the time, spend the (minor amount) of money and get a good size sand sample.
There are a multitude of laboratory techniques for measuring particle size distribution (PSD). These include sieve analysis (wet and dry), sedimentation, air permeability, elutriation, optical and electron microscopy with computer image analysis, Coulter principle, dynamic light scattering, and laser diffraction analysis – to name a few.
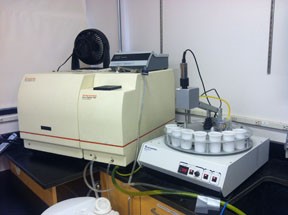
Within the realm of the upstream oil & gas industry – and general techniques that should be available in all geographic regions – the two recommended (and most common) are Sieve Analysis and Laser Diffraction Analysis (LDA). My preference is always Sieve Analysis – if sufficient sample size is present – however LDA is the most used since it takes a small sample and is the easy (lazy) method.
Sieve Analysis
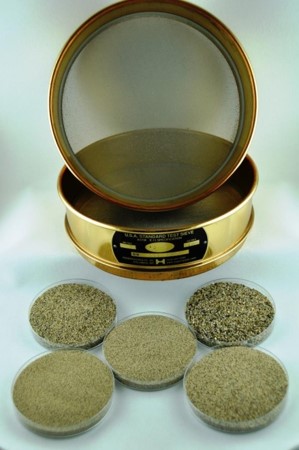
Description: Particles segregated into size fractions by using a nested column of stacked wire mesh sieves. The column is shaken/tapped for 3-5 minutes, then the material remaining on each sieve is weighed.
Method:
- ASTM C136 Test Method for Analysis of Fine and Coarse Aggregates
- ASTM C117 Test Method for Materials Finer than 75 µm (No. 200) Sieve in Mineral Aggregates by Washing
Pros:
- Provides true size data (not density dependent)
- Established method and data analysis
- Provides accurate analysis, especially wet
- No upper size limit
Cons
- Requires >100 gram sample (usually at least 250 grams needed)
- Can be time consuming, especially wet
- Limited to particles >37 microns
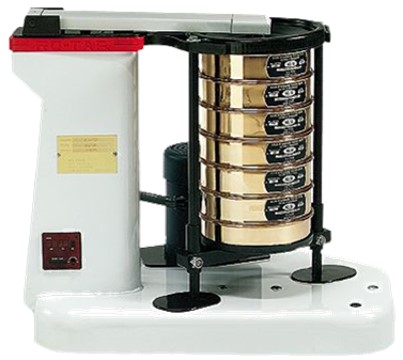
Photo below shows dry sieve shaker (www.wstyler.com)