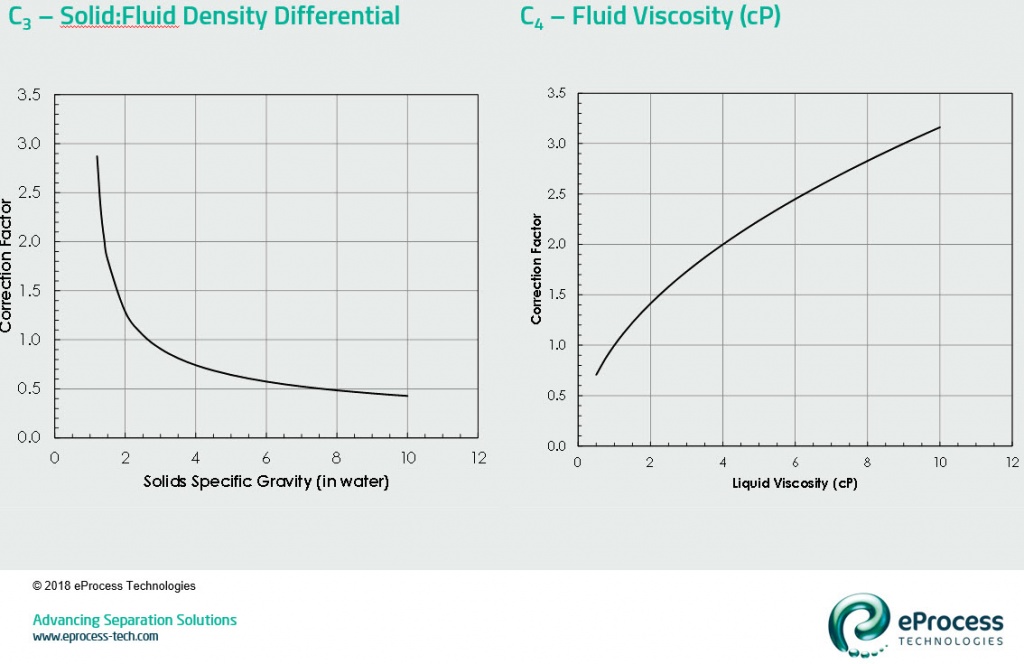
C3 – Solid:Fluid Density (using specific gravity)
Correction factor C3 is applied for the solid:fluid density differential. The base conditions are sand at 2.65 s.g. in water at 1.0 s.g. (see post B-FSM-055). At these conditions C3=1.0. as the density differential increases it becomes easier to separate the solids from the liquid. Either making the solids heavier or making the liquid less dense achieve the same effect. Most oilfield solids range from 2.5-2.8 specific gravity (see post B-FSM-008 from 12-Sep-17). Produced water ranges from 0.7-1.2 s.g. normally based on the amount of dissolved solids and the process temperature. Increasing the total dissolved solids (TDS) increases fluid density, while increasing process temperature lowers fluid density. For example, alumina-based proppant (2.85 s.g.) in produced water with 10% TDS at 50°C (1.06 s.g.) would yield a value of C3 = 0.96.
C4 – Fluid Viscosity
Fluid viscosity has a very significant affect on desander performance, and is accounted for by correction factor C4. The guideline is that the continuous phase fluid viscosity correction factor is the square root of the viscosity based in cP. Thus at 1.0 cP, C4 = 1.0 and at 10 cP, C4 = 3.16. This can have a dramatic effect on desander separation efficiency, thus it always best to put the desander on the lowest viscosity fluid. Typically this is at the hottest location. As produced water leaves the production separator or FWKO it will drop in temperature, so all hydrocyclone technologies (desanders and deoilers) should be put directly on the outlet line where the viscosity is lowest.
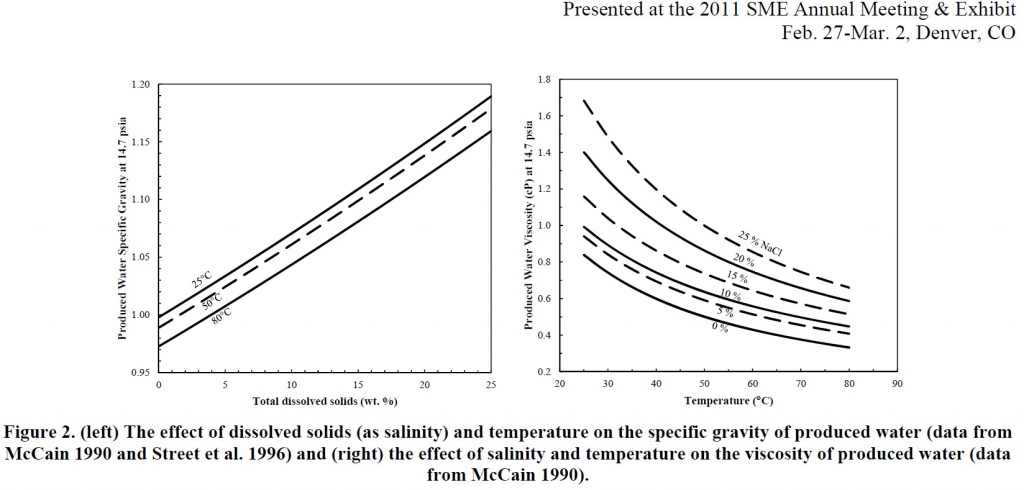
Values for produced water density and viscosity can be obtained from McCain (Ref. 3). I have also listed several graphs below that should be of help. These are from my oil droplet flotation publication (Ref. 4). Both amount of dissolved solids and temperature change produced water density and viscosity per the relationships presented.