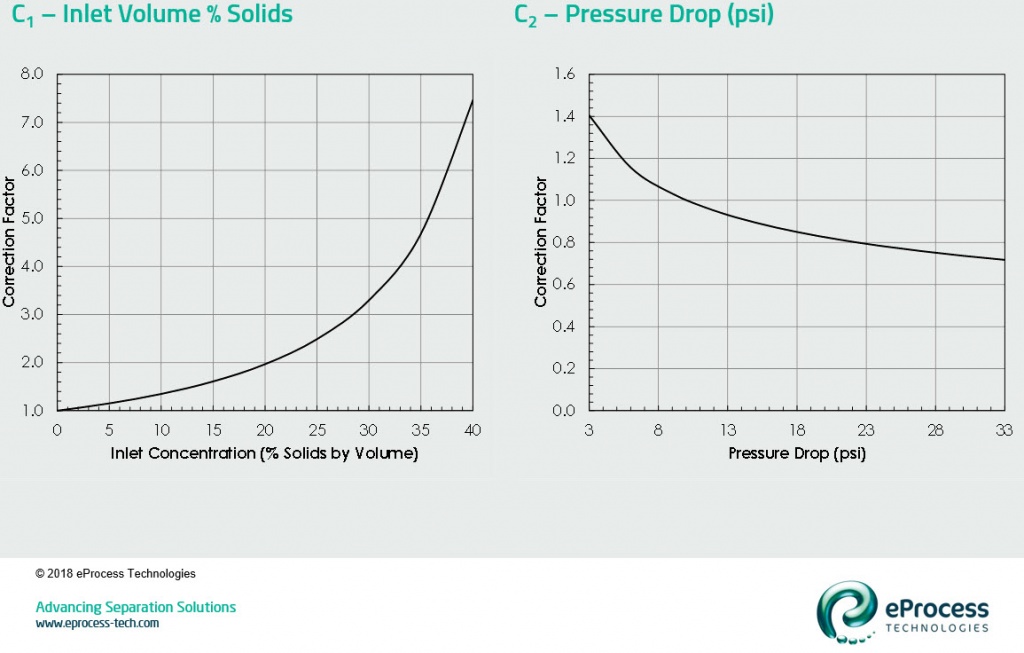
C1 – Inlet Volume % Solids
Correction factor 1 (C1) is applied for the concentration of solids in the inlet fluids. The baseline correction factor of 1.0 is 0.0 vol. % solids (see post B-FSM-055). As the concentration of solids increase in the fluid steam, particle-particle interaction and crowding will reduce the efficiency of the desander separation. This correction factor is minor at low solids concentration. At 5 vol.% solids, the correction is only 1.1.
The good news is that most every desander application in upstream oil and gas is <<1.0 vol.% solids. In effect this correction factor rarely deviates more than a few percent (i.e. 1.01-1.03). The fun part is converting from field units – which vary from mg/l to pptb to kg/d to “buckets of sand in my pick-up that I sucked out of the separator” – into volume percent solids. Post B-FSM-022 from 09-Jan-18 can provide some guidance (redneck units are not covered).
C2 – Pressure Drop
Pressure drop is probably the most important correction factor. All other factors are really a factor of the existing process that you cannot practically change in-situ (i.e. solids concentration, particle density, fluid viscosity, etc.). However, pressure drop will and can change frequently – both on purpose or as the nature of the process. Pressure drop is a function of fluid throughput. As you increase the flow rate the pressure drop increases, and vice versa.
Correction factor 2 (C2) shows the effect of pressure drop. As pressure drop increases (from fluid throughput increase), the tangential (separating) velocity increases (see post B-FSM-049). The base condition for correction is 10 psi pressure drop (see post B-FSM-055) which is a correction of 1.0. Increasing the pressure drop lowers the correction factor (i.e. at 25 psi C2 = 0.78), while lowering does the opposite (at 5 psi C2 = 1.20). Pressure drop is measured from desander inlet to overflow.
From our previous example of a 10” insert desander (with D50base = 22 microns), at dilute concentration (C1=1.0) and 25 psi pressure drop operation (C2 = 0.78), the D50req. now decreases to 17 microns.
The next article discusses corrections for solid:fluid density differential (C3) and fluid viscosity (C4).
References
- Plitt, L.R., “A mathematical model of the hydrocyclone classifier”, CIM Bulletin, December, 1976, pp. 115-123.
- Rawlins, C.H., and Wang, I. I., “Design and Installation of a Sand Separation and Handling System for a Gulf of Mexico Oil Production Facility,” SPE Production and Facilities, paper 72999, Vol. 16, No. 3, 2001, pp. 134-140.
- Svarovsky, L., “Hydrocyclones”, Technomics Publishing Co. Inc., Lancaster, PA, 1984.