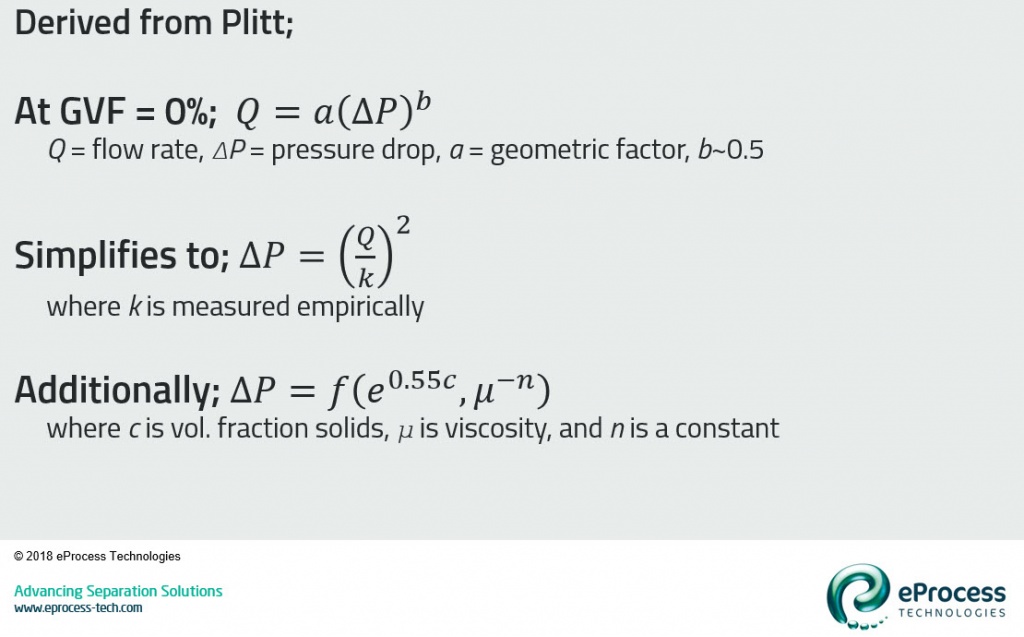
For liquid-only flow (e.g. gas void fraction = 0%), the flow rate (Q) shows a power law relationship with pressure drop (ΔP). This relationship has two constants that must be determined experimentally for each specific desander geometry – a and b. The power factor (b) can be normalized to 0.5 – thus the relationship is flow rate is proportional to square root of pressure drop.
This relationship can be rearranged and simplified to the form of ΔP equals the square of Q/k. k is termed the k-factor and measured experimentally. Many desander suppliers will publish their k-factor on their capacity curves.
Other process factors will affect throughput (pressure drop). These include volume fraction of solids suspended in the liquid (c) and viscosity of the fluid (µ). These are secondary factors and with suspensions of dilute sand in water show negligible effect. When the carrier fluid is highly viscous (>10 cP) some effect on capacity is shown.
The next article will discuss hydraulic capacity, turndown, and performance of liner style desanders.
References
- Plitt, L.R., “A mathematical model of the hydrocyclone classifier”, CIM Bulletin, December, 1976, pp. 115-123.