eProcess Technologies

Produced Solids Particle Size Measurement Data Analysis: Part 1 (B-FSM017)

The +30 Mesh (600 micron) Fraction of a Produced Sand Sample - Gradation Marks are 1 mm

In the previous article we covered Particle Size Analysis. This measurement, especially when done with Laser Diffraction Analysis (LDA), can generate a substantial amount of data. Most of it is superfluous, and the purpose of this article is to provide guidelines on how to sift (pun intended) through the data and pull out what is of use in designing a Facilities Sand Management system.

Data Format for Analysis

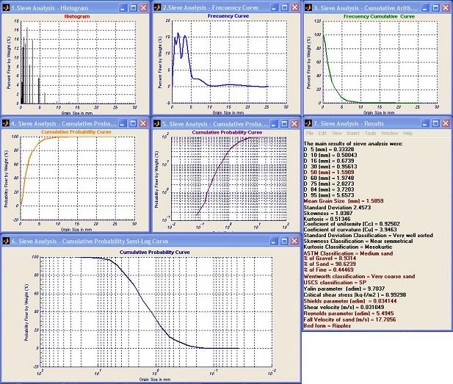
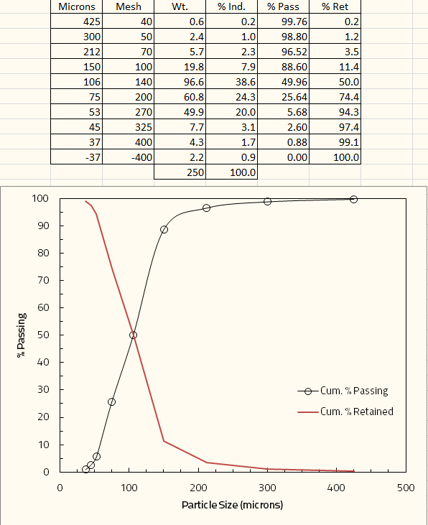
Computer driven analysis, like LDA, tends to provide graphical data output. However tabular data is needed for calculation and analysis – so set aside the pretty graphs and get the data in a format you can import into a spreadsheet. The output below looks sophisticated, but does not allow the user to do any reasonable calculations with the results. Get the data into a table that shows Individual Size/Wt. % – a breakdown of each size range and the amount within that range.

Note: I assume this is obvious, but I’ve seen plenty of abnormal data sets – the analysis should be performed on Total Suspended Solids (TSS) and NOT on Total Dissolved Solids (TDS).

Data Organization and Interpretation

Analyze Tabular Data Yourself

  • Does sample add to 100%? (most common mistake I see)
  • Does sample include top-size (100% passing size)?
  • Calculate Individual Percent and plot Cumulative % Passing (and maybe Cumulative % Retained)
  • Does data have sufficient number of discrete points/steps – at least 10 needed, but more than 25 is getting too fine a data gradation

The table and graph below show results from sieve analysis of produced sand. The data is presented in tabular and graphical format. The data does show 10 discrete points – however it does not show the 100% passing size. The end-user assumes the top size is less than the next sieve size in the series (600 micron / 30 mesh) but that may not always be the case.

Does Analysis Make Sense?

  • Do you see a bimodal distribution (may indicate error in sampling)?
  • Does the data show any gaps or step-changes (may indicate error in measurement)?
  • Can the analysis be duplicated by another lab (may indicate error in analysis method)?
  • How important is accuracy to you (i.e. is sloppy sampling or analysis that critical to your calculations)?

References:

  1. ISO 9276-1:1998. Representation of results of particle size analysis – Part 1: Graphical Representation.
  2. ISO 9276-2:2014. Representation of results of particle size analysis – Part 2: Calculation of average particle sizes/diameters and moments from particle size distributions.

We will continue with data analysis in the next article. 

Comments are closed.


white

Copyright © 2024 eProcess Technologies.