Sampling of Particulate Solids in Oil & Gas Production – Part 2: Sample Size (B-FSM010)

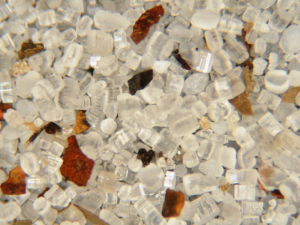
Particulate Solids Consisting of Sand, Corrosion Products, and Gypsum from Oil Well (Screened sample 106-600 microns, 20X magnification)
The 1st Rule of Sand Management is “Know what comes out of your well.” Sampling is required to know the properties and nature of the particulate material associated with well production. This article is the second of two that provides guidance for purpose, methods, quantity, and storage of solids samples from oil & gas production.
Compared to oil and water, solids are quite dilute in well flow. To get a representative sample for physical analysis requires larger sample sizes than oil and gas operators are used to providing. Bottle grab and Millipore samples will not provide the accuracy required to design
a Facilities Sand Management system (though that is often what is provided – leading to mismatch of equipment in the field).
This article list simple statistics to provide guidance for sample size and number. Note: this is not meant to be a treatise on statistical sampling but provide simple calculations that can be done with a calculator in the field to quickly estimate sample information.
Sample Size
Goal: To minimize standard deviation from sampling.
Where s is relative standard deviation, p is probability of selecting particle, and n is number of particles in sample.
Example: Cyclone desander on produced water stream
- Sand particle (2650 kg/m³) in produced water (1050 kg/m³)
- Assumed homogeneous distribution (both spatially and with time)
- Inlet to desander has 100 ppmv sand, and overflow has 5 ppmv (95% separation efficiency of desander)
- Average particle diameter (Dp): 100 µm inlet and 15 µm overflow
- Target of 1% relative standard deviation (s=0.01)
- 99% probability (p=0.0001)
- Inlet n = 99,990,000 particles = 138.7 grams (requires 523 liters of water)
- Overflow n = 99,990,000 particles = 0.47 grams (35.3 liters of water)
Number of Samples
Goal: To minimize sample error.
Where n is number of samples required, z from statistics table, s is standard deviation for sampling, and e is error.
Example: Cyclone desander on produced water stream
- Sand particle (2650 kg/m³) in produced water (1050 kg/m³)
- Inlet to desander has 100 ppmv sand, and overflow has 5 ppmv (95% separation efficiency of desander)
- Average particle diameter (Dp): 100 µm inlet and 15 µm overflow
- Target is 1% standard deviation (s=0.01) and 1% relative sampling error (e=0.01) at 99% confidence level (z=2.33)
- n = 6
- Total inlet sample is 832 grams (3141 liters)
- Total overflow sample is 2.82 grams (212 liters)
These calculations show that a substantial amount of liquid is needed for a highly accurate sample. Up to 3.1 m³ (830 gallons) is required on the inlet stream. These requirements – which give high accuracy – may not be practical in most situations. Be relaxing the standard deviation and error from 1% to 5% will greatly reduce the volume required.
Minimize Sample Size and Number
- Sand particle (2650 kg/m³) in produced water (1050 kg/m³)
- Inlet to desander has 100 ppmv sand, and overflow has 5 ppmv (95% separation efficiency of desander)
- Average particle diameter (Dp): 100 µm inlet and 15 µm overflow
- Use 5% relative standard deviation and 5% relative sampling error at 95% confidence level
- Inlet n = 5.55 grams, n = 3
- Total sample is 16.65 grams = 62.8 liters liquid
- Overflow n = 0.02 grams, n = 3
- Total sample is 0.06 grams = 4.2 liters of liquid
- Recommend composite of samples taken at 5-10 minute intervals
This level applicable is applicable for general cyclone analysis.
